Binary black hole mergers are the ultimate laboratory for testing gravity. The gravitational fields are strong, and things are moving at close to the speed of light. these extreme conditions are exactly where we expect our theories could breakdown, which is why we were so exciting by detecting gravitational waves from black hole coalescences. To accompany the first detection of gravitational waves, we performed several tests of Einstein’s theory of general relativity (it passed). This paper outlines the details of one of the tests, one that can be extended to include future detections to put Einstein’s theory to the toughest scrutiny.
One of the difficulties of testing general relativity is what do you compare it to? There are many alternative theories of gravity, but only a few of these have been studied thoroughly enough to give an concrete idea of what a binary black hole merger should look like. Even if general relativity comes out on top when compared to one alternative model, it doesn’t mean that another (perhaps one we’ve not thought of yet) can be ruled out. We need ways of looking for something odd, something which hints that general relativity is wrong, but doesn’t rely on any particular alternative theory of gravity.
The test suggested here is a consistency test. We split the gravitational-wave signal into two pieces, a low frequency part and a high frequency part, and then try to measure the properties of the source from the two parts. If general relativity is correct, we should get answers that agree; if it’s not, and there’s some deviation in the exact shape of the signal at different frequencies, we can get different answers. One way of thinking about this test is imagining that we have two experiments, one where we measure lower frequency gravitational waves and one where we measure higher frequencies, and we are checking to see if their results agree.
To split the waveform, we use a frequency around that of the last stable circular orbit: about the point that the black holes stop orbiting about each other and plunge together and merge [bonus note]. For GW150914, we used 132 Hz, which is about the same as the C an octave below middle C (a little before time zero in the simulation below). This cut roughly splits the waveform into the low frequency inspiral (where the two black hole are orbiting each other), and the higher frequency merger (where the two black holes become one) and ringdown (where the final black hole settles down).
We are fairly confident that we understand what goes on during the inspiral. This is similar physics to where we’ve been testing gravity before, for example by studying the orbits of the planets in the Solar System. The merger and ringdown are more uncertain, as we’ve never before probed these strong and rapidly changing gravitational fields. It therefore seems like a good idea to check the two independently [bonus note].
We use our parameter estimation codes on the two pieces to infer the properties of the source, and we compare the values for the mass and spin of the final black hole. We could use other sets of parameters, but this pair compactly sum up the properties of the final black hole and are easy to explain. We look at the difference between the estimated values for the mass and spin, and , if general relativity is a good match to the observations, then we expect everything to match up, and and to be consistent with zero. They won’t be exactly zero because we have noise in the detector, but hopefully zero will be within the uncertainty region [bonus note]. An illustration of the test is shown below, including one of the tests we did to show that it does spot when general relativity is not correct.
Results from the consistency test. The top panels show the outlines of the 50% and 90% credible levels for the low frequency (inspiral) part of the waveform, the high frequency (merger–ringdown) part, and the entire (inspiral–merger–ringdown, IMR) waveform. The bottom panel shows the fractional difference between the high and low frequency results. If general relativity is correct, we expect the distribution to be consistent with , indicated by the cross (+). The left panels show a general relativity simulation, and the right panel shows a waveform from a modified theory of gravity. Figure 1 of Ghosh et al. (2016).
A convenient feature of using and to test agreement with relativity, is that you can combine results from multiple observations. By averaging over lots of signals, you can reduce the uncertainty from noise. This allows you to pin down whether or not things really are consistent, and spot smaller deviations (we could get precision of a few percent after about 100 suitable detections). I look forward to seeing how this test performs in the future!
I became involved in this work as a reviewer. The LIGO Scientific Collaboration is a bit of a stickler when it comes to checking its science. We had to check that the test was coded up correctly, that the results made sense, and that calculations done and written up for GW150914 were all correct. Since most of the team are based in India [bonus note], this involved some early morning telecons, but it all went smoothly.
One of our checks was that the test wasn’t sensitive to exact frequency used to split the signal. If you change the frequency cut, the results from the two sections do change. If you lower the frequency, then there’s less of the low frequency signal and the measurement uncertainties from this piece get bigger. Conversely, there’ll be more signal in the high frequency part and so we’ll make a more precise measurement of the parameters from this piece. However, the overall results where you combine the two pieces stay about the same. You get best results when there’s a roughly equal balance between the two pieces, but you don’t have to worry about getting the cut exactly on the innermost stable orbit.
Golden binaries
In order for the test to work, we need the two pieces of the waveform to both be loud enough to allow us to measure parameters using them. This type of signals are referred to as golden. Earlier work on tests of general relativity using golden binaries has been done by Hughes & Menou (2015), and Nakano, Tanaka & Nakamura (2015). GW150914 was a golden binary, but GW151226 and LVT151012 were not, which is why we didn’t repeat this test for them.
GW150914 results
For The Event, we ran this test, and the results are consistent with general relativity being correct. The plots below show the estimates for the final mass and spin (here denoted rather than ), and the fractional difference between the two measurements. The points is at the 28% credible level. This means that if general relativity is correct, we’d expect a deviation at this level to occur around-about 72% of the time due to noise fluctuations. It wouldn’t take a particular rare realisation of noise to cause the assume true value of to be found at this probability level, so we’re not too suspicious that something is amiss with general relativity.
Results from the consistency test for The Event. The top panels final mass and spin measurements from the low frequency (inspiral) part of the waveform, the high frequency (post-inspiral) part, and the entire (IMR) waveform. The bottom panel shows the fractional difference between the high and low frequency results. If general relativity is correct, we expect the distribution to be consistent with , indicated by the cross. Figure 3 of the Testing General Relativity Paper.
The authors
Abhirup Ghosh and Archisman Ghosh were two of the leads of this study. They are both A. Ghosh at the same institution, which caused some confusion when compiling the LIGO Scientific Collaboration author list. I think at one point one of them (they can argue which) was removed as someone thought there was a mistaken duplication. To avoid confusion, they now have their full names used. This is a rare distinction on the Discovery Paper (I’ve spotted just two others). The academic tradition of using first initials plus second name is poorly adapted to names which don’t fit the typical western template, so we should be more flexible.
The first observing run (O1) of Advanced LIGO was scheduled to start 9 am GMT (10 am BST), 14 September 2015. Both gravitational-wave detectors were running fine, but there were few a extra things the calibration team wanted to do and not all the automated analysis had been set up, so it was decided to postpone the start of the run until 18 September. No-one told the Universe. At 9:50 am, 14 September there was an event. To those of us in the Collaboration, it is known as The Event.
The Event’s signal as measured by LIGO Hanford and LIGO Livingston. The shown signal has been filtered to make it more presentable. The Hanford signal is inverted because of the relative orientations of the two interferometers. You can clearly see that both observatories see that same signal, and even without fancy analysis, that there are definitely some wibbles there! Part of Fig. 1 from the Discovery Paper.
Detection
The detectors were taking data and the coherent WaveBurst (cWB) detection pipeline was set up analysing this. It finds triggers in near real time, and so about 3 minutes after the gravitational wave reached Earth, cWB found it. I remember seeing the first few emails… and ignoring them—I was busy trying to finalise details for our default parameter-estimation runs for the start of O1. However, the emails kept on coming. And coming. Something exciting was happening. The detector scientists at the sites swung in to action and made sure that the instruments would run undisturbed so we could get lots of data about their behaviour; meanwhile, the remaining data analysis codes were set running with ruthless efficiency.
The cWB algorithm doesn’t search for a particular type of signal, instead it looks for the same thing in both detectors—it’s what we call a burst search. Burst searches could find supernova explosions, black hole mergers, or something unexpected (so long as the signal is short). Looking at the data, we saw that the frequency increased with time, there was the characteristic chirp of a binary black hole merger! This meant that the searches that specifically look for the coalescence of binaries (black hole or neutron stars) should find it too, if the signal was from a binary black hole. It also meant that we could analyse the data to measure the parameters.
A time–frequency plot that shows The Event’s signal power in the detectors. You can see the signal increase in frequency as time goes on: the characteristic chirp of a binary merger! The fact that you can spot the signal by eye shows how loud it is. Part of Fig. 1 from the Discovery Paper.
The signal was quite short, so it was quick for us to run parameter estimation on it—this makes a welcome change as runs on long, binary neutron-star signals can take months. We actually had the first runs done before all the detection pipelines had finished running. We kept the results secret: the detection people didn’t want to know the results before they looked at their own results (it reminded me of the episode of Whatever Happened to the Likely Lads where they try to avoid hearing the results of the football until they can watch the match). The results from each of the detection pipelines came in [bonus note]. There were the other burst searches: LALInferenceBurst found strong evidence for a signal, and BayesWave classified it clearly as a signal, not noise or a glitch; then the binary searches: both GstLAL and PyCBC found the signal (the same signal) at high significance. The parameter-estimation results were beautiful—we had seen the merger of two black holes!
At first, we couldn’t quite believe that we had actually made the detection. The signal seemed too perfect. Famously, LIGO conducts blind injections: fake signals are secretly put into the data to check that we do things properly. This happened during the run of initial LIGO (an event known as the Big Dog), and many people still remembered the disappointment. We weren’t set up for injections at the time (that was part of getting ready for O1), and the heads of the Collaboration said that there were no plans for blind injections, but people wanted to be sure. Only three or four people in the Collaboration can perform a blind injection; however, it’s a little publicised fact that you can tell if there was an injection. The data from the instruments is recorded at many stages, so there’s a channel which records the injected signal. During a blind-injection run, we’re not allowed to look at this, but this wasn’t a blind-injection run, so this was checked and rechecked. There was nothing. People considered other ways of injecting the signal that wouldn’t be recorded (perhaps splitting the signal up and putting small bits in lots of different systems), but no-one actually understands all the control systems well enough to get this to work. There were basically two ways you could fake the signal. The first is hack into the servers at both sites and CalTech simultaneously and modify the data before it got distributed. You would need to replace all the back-ups and make sure you didn’t leave any traces of tampering. You would also need to understand the control system well enough that all the auxiliary channels (the signal as recorded at over 30 different stages throughout the detectors’ systems) had the right data. The second is to place a device inside the interferometers that would inject the signal. As long as you had a detailed understanding of the instruments, this would be simple: you’d just need to break into both interferometers without being noticed. Since the interferometers are two of the most sensitive machines ever made, this is like that scene from Mission:Impossible, except on the actually impossible difficulty setting. You would need to break into the vacuum tube (by installing an airlock in the concrete tubes without disturbing the seismometers), not disturb the instrument while working on it, and not scatter any of the (invisible) infra-red laser light. You’d need to do this at both sites, and then break in again to remove the devices so they’re not found now that O1 is finished. The devices would also need to be perfectly synchronised. I would love to see a movie where they try to fake the signal, but I am convinced, absolutely, that the easiest way to inject the signal is to collide two black holes a billion years ago. (Also a good plot for a film?)
I still remember the exact moment this hit me. I was giving a public talk on black holes. It was a talk similar to ones I have given many times before. I start with introducing general relativity and the curving of spacetime, then I talk about the idea of a black hole. Next I move on to evidence for astrophysical black holes, and I showed the video zooming into the centre of the Milky Way, ending with the stars orbiting around Sagittarius A*, the massive black hole in the centre of our galaxy (shown below). I said that the motion of the stars was our best evidence for the existence of black holes, then I realised that this was no longer the case. Now, we have a whole new insight into the properties of black holes.
Gravitational-wave astronomy
Having caught a gravitational wave, what do you do with it? It turns out that there’s rather a lot of science you can do. The last few months have been exhausting. I think we’ve done a good job as a Collaboration of assembling all the results we wanted to go with the detection—especially since lots of things were being done for the first time! I’m sure we’ll update our analysis with better techniques and find new ways of using the data, but for now I hope everyone can enjoy what we have discovered so far.
The results of our parameter-estimation runs tell us about the nature of the source. We have a binary with objects of masses and , where indicates the mass of our Sun (about kilograms). If you’re curious what’s going with these numbers and the pluses and minuses, check out this bonus note.
Estimated masses for the two black holes in the binary. is the mass of the heavier black hole and is the mass of the lighter black hole. The dotted lines mark the edge of our 90% probability intervals. The different coloured curves show different models: they agree which made me incredibly happy! Fig. 1 from the Parameter Estimation Paper.
We know that we’re dealing with compact objects (regular stars could never get close enough together to orbit fast enough to emit gravitational waves at the right frequency), and the only compact objects that can be as massive as these object are black holes. This means we’re discovered the first stellar-mass black hole binary! We’ve also never seen stellar-mass black holes (as opposed to the supermassive flavour that live in the centres of galaxies) this heavy, but don’t get too attached to that record.
Black holes have at most three properties. This makes them much simpler than a Starbucks Coffee (they also stay black regardless of how much milk you add). Black holes are described by their mass, their spin (how much they rotate), and their electric charge. We don’t expect black holes out in the Universe to have much electric charge because (i) its very hard to separate lots of positive and negative charge in the first place, and (ii) even if you succeed at (i), it’s difficult to keep positive and negative charge apart. This is kind of like separating small children and sticky things that are likely to stain. Since the electric charge can be ignored, we just need mass and spin. We’ve measured masses, can we measure spins?
Black hole spins are defined to be between 0 (no spin) and 1 (the maximum amount you can have). Our best estimates are that the bigger black hole has spin , and the small one has spin (these numbers have been rounded). These aren’t great measurements. For the smaller black hole, its spin is almost equally probable to take any allowed value; this isn’t quite the case, but we haven’t learnt much about its size. For the bigger black hole, we do slightly better, and it seems that the spin is on the smaller side. This is interesting, as measurements of spins for black holes in X-ray binaries tend to be on the higher side: perhaps there are different types of black holes?
We can’t measure the spins precisely for a few reasons. The signal is short, so we don’t see lots of wibbling while the binaries are orbiting each other (the tell-tale sign of spin). Results for the orientation of the binary also suggest that we’re looking at it either face on or face off, which makes any wobbles in the orbit that are there less visible. However, there is one particular combination of the spins, which we call the effective spin, that we can measure. The effective spin controls how the black holes spiral together. It has a value of 1 if both black holes have max spin values, and are rotating the same way as the binary is orbiting. It has a value of −1 if the black holes have max spin values and are both rotating exactly the opposite way to the binary’s orbit. We find that the effective spin is small, . This could mean that both black holes have small spins, or that they have larger spins that aren’t aligned with the orbit (or each other). We have learnt something about the spins, it’s just not too easy to tease that apart to give values for each of the black holes.
As the two black holes orbit each other, they (obviously, given what we’ve seen) emit gravitational waves. These carry away energy and angular momentum, so the orbit shrinks and the black holes inspiral together. Eventually they merge and settle down into a single bigger black hole. All this happens while we’re watching (we have great seats). A simulation of this happening is below. You can see that the frequency of the gravitational waves is twice that of the orbit, and the video freezes around the merger so you can see two become one.
What are the properties of the final black hole? The mass of the remnant black holes is . It is the new record holder for the largest observed stellar-mass black hole!
If you do some quick sums, you’ll notice that the final black hole is lighter than the sum of the two initial black holes. This is because of that energy that was carried away by the gravitational waves. Over the entire evolution of the system, of energy was radiated away as gravitational waves (where is the speed of light as in Einstein’s famous equation). This is a colossal amount of energy. You’d need to eat over eight billion times the mass of the Sun in butter to get the equivalent amount of calories. (Do not attempt the wafer-thin mint afterwards). The majority of that energy is radiated within the final second. For a brief moment, this one black hole merger outshines the whole visible Universe if you compare its gravitational-wave luminosity, to everything else’s visible-light luminosity!
We’ve measured mass, what about spin? The final black hole’s spin in , which is in the middling-to-high range. You’ll notice that we can deduce this to a much higher precisely than the spins of the two initial black holes. This is because it is largely fixed by the orbital angular momentum of the binary, and so its value is set by orbital dynamics and gravitational physics. I think its incredibly satisfying that we we can such a clean measurement of the spin.
We have measured both of the properties of the final black hole, and we have done this using spacetime itself. This is astounding!
Estimated mass and spin for the final black hole. The dotted lines mark the edge of our 90% probability intervals. The different coloured curves show different models: they agree which still makes me incredibly happy! Fig. 3 from the Parameter Estimation Paper.
How big is the final black hole? My colleague Nathan Johnson-McDaniel has done some calculations and finds that the total distance around the equator of the black hole’s event horizon is about (about six times the length of the M25). Since the black hole is spinning, its event horizon is not a perfect sphere, but it bulges out around the equator. The circumference going over the black hole’s poles is about (about five and a half M25s, so maybe this would be the better route for your morning commute). The total area of the event horizon is about . If you flattened this out, it would cover an area about the size of Montana. Neil Cornish (of Montana State University) said that he’s not sure which we know more accurately: the area of the event horizon or the area of Montana!
OK, we’ve covered the properties of the black holes, perhaps it’s time for a celebratory biscuit and a sit down? But we’re not finished yet, where is the source?
We infer that the source is at a luminosity distance of , a megaparsec is a unit of length (regardless of what Han Solo thinks) equal to about 3 million light-years. The luminosity distance isn’t quite the same as the distance you would record using a tape measure because it takes into account the effects of the expansion of the Universe. But it’s pretty close. Using our 90% probability range, the merger would have happened sometime between 700 million years and 1.6 billion years ago. This coincides with the Proterozoic Eon on Earth, the time when the first oxygen-dependent animals appeared. Gasp!
With only the two LIGO detectors in operation, it is difficult to localise where on the sky source came from. To have a 90% chance of finding the source, you’d need to cover of the sky. For comparison, the full Moon is about . This is a large area to cover with a telescope, and we don’t expect there to be anything to see for a black hole merger, but that hasn’t stopped our intrepid partners from trying. For a lovely visualisation of where we think the source could be, marvel at the Gravoscope.
Astrophysics
The detection of this black hole merger tells us:
Black holes 30 times the mass of our Sun do form These must be the remains of really massive stars. Stars lose mass throughout their lifetime through stellar winds. How much they lose depends on what they are made from. Astronomers have a simple periodic table: hydrogen, helium and metals. (Everything that is not hydrogen or helium is a metal regardless of what it actually is). More metals means more mass loss, so to end up with our black holes, we expect that they must have started out as stars with less than half the fraction of metals found in our Sun. This may mean the parent stars were some of the first stars to be born in the Universe.
Binary black holes exist There are two ways to make a black hole binary. You can start with two stars in a binary (stars love company, so most have at least one companion), and have them live their entire lives together, leaving behind the two black holes. Alternatively, you could have somewhere where there are lots of stars and black holes, like a globular cluster, and the two black holes could wander close enough together to form the binary. People have suggested that either (or both) could happen. You might be able to tell the two apart using spin measurements. The spins of the black holes are more likely to be aligned (with each other and the way that the binary orbits) if they came from stars formed in a binary. The spins would be randomly orientated if two black holes came together to form a binary by chance. We can’t tell the two apart now, but perhaps when we have more observations!
Binary black holes merge Since we’ve seen a signal from two black holes inspiralling together and merging, we know that this happens. We can also estimate how often this happens, given how many signals we’ve seen in our observations. Somewhere in the observable Universe, a similar binary could be merging about every 15 minutes. For LIGO, this should mean that we’ll be seeing more. As the detectors’ sensitivity improves (especially at lower frequencies), we’ll be able to detect more and more systems [bonus note]. We’re still uncertain in our predictions of exactly how many we’ll see. We’ll understand things better after observing for longer: were we just lucky, or were we unlucky not to have seen more? Given these early results, we estimate that the end of the third observing run (O3), we could have over 30. It looks like I will be kept busy over the next few years…
Gravitational physics
Black holes are the parts of the Universe with the strongest possible gravity. They are the ideal place to test Einstein’s theory of general relativity. The gravitational waves from a black hole merger let us probe right down to the event horizon, using ripples in spacetime itself. This makes gravitational waves a perfect way of testing our understanding of gravity.
We have run some tests on the signal to see how well it matches our expectations. We find no reason to doubt that Einstein was right.
The first check is that if we try to reconstruct the signal, without putting in information about what gravitational waves from a binary merger look like, we find something that agrees wonderfully with our predictions. We can reverse engineer what the gravitational waves from a black hole merger look like from the data!
Recovered gravitational waveforms from our analysis of The Event. The dark band shows our estimate for the waveform without assuming a particular source (it is build from wavelets, which sound adorable to me). The light bands show results if we assume it is a binary black hole (BBH) as predicted by general relativity. They match really well! Fig. 6 from the Parameter Estimation Paper.
As a consistency test, we checked what would happen if you split the signal in two, and analysed each half independently with our parameter-estimation codes. If there’s something weird, we would expect to get different results. We cut the data into a high frequency piece and a low frequency piece at roughly where we think the merger starts. The lower frequency (mostly) inspiral part is more similar to the physics we’ve tested before, while the higher frequency (mostly) merger and ringdown is new and hence more uncertain. Looking at estimates for the mass and spin of the final black hole, we find that the two pieces are consistent as expected.
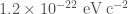
In general relativity, gravitational waves travel at the speed of light. (The speed of light is misnamed, it’s really a property of spacetime, rather than of light). If gravitons, the theoretical particle that carries the gravitational force, have a mass, then gravitational waves can’t travel at the speed of light, but would travel slightly slower. Because our signals match general relativity so well, we can put a limit on the maximum allowed mass. The mass of the graviton is less than (in units that the particle physicists like). This is tiny! It is about as many times lighter than an electron as an electron is lighter than a teaspoon of water (well, , which is just under a full teaspoon), or as many times lighter than the almost teaspoon of water is than three Earths.
Bounds on the Compton wavelength of the graviton from The Event (GW150914). The Compton wavelength is a length defined by the mass of a particle: smaller masses mean large wavelengths. We place much better limits than existing tests from the Solar System or the double pulsar. There are some cosmological tests which are stronger still (but they make assumptions about dark matter). Fig. 8 from the Testing General Relativity Paper.
Overall things look good for general relativity, it has passed a tough new test. However, it will be extremely exciting to get more observations. Then we can combine all our results to get the best insights into gravity ever. Perhaps we’ll find a hint of something new, or perhaps we’ll discover that general relativity is perfect? We’ll have to wait and see.
Conclusion
100 years after Einstein predicted gravitational waves and Schwarzschild found the equations describing a black hole, LIGO has detected gravitational waves from two black holes orbiting each other. This is the culmination of over forty years of effort. The black holes inspiral together and merge to form a bigger black hole. This is the signal I would have wished for. From the signal we can infer the properties of the source (some better than others), which makes me exceedingly happy. We’re starting to learn about the properties of black holes, and to test Einstein’s theory. As we continue to look for gravitational waves (with Advanced Virgo hopefully joining next year), we’ll learn more and perhaps make other detections too. The era of gravitational-wave astronomy has begun!
After all that, I am in need of a good nap! (I was too excited to sleep last night, it was like a cross between Christmas Eve and the night before final exams). For more on the story from scientists inside the LIGO–Virgo Collaboration, check out posts by:
Matt Pitkin (the tireless reviewer of our parameter-estimation work)
Sean Leavey (a PhD student working on on interferometry)
Andrew Williamson (who likes to look for gravitational waves that coincide with gamma-ray bursts)
Shane Larson (another fan of space-based gravitational-wave detectors)
Roy Williams (who helps to make all the wonderful open data releases for LIGO)
Chris North (creator of the Gravoscope amongst other things)
There’s also this video from my the heads of my group in Birmingham on their reactions to the discovery (the credits at the end show how large an effort the detection is).
At the Large Hadron Collider, there are separate experiments that independently analyse data, and this is an excellent cross-check of any big discoveries (like the Higgs). We’re not in a position to do this for gravitational waves. However, the different search pipelines are mostly independent of each other. They use different criteria to rank potential candidates, and the burst and binary searches even look for different types of signals. Therefore, the different searches act as a check of each other. The teams can get competitive at times, so they do check each other’s results thoroughly.
The announcement
Updating Have we detected gravitational waves yet? was doubly exciting as I had to successfully connect to the University’s wi-fi. I managed this with about a minute to spare. Then I hovered with my finger on the button until David Reitze said “We. Have detected. Gravitational waves!” The exact moment is captured in the video below, I’m just off to the left.
The moment of the announcement of the first observation of gravitational waves at the University of Birmingham. Credit: Kat Grover
Parameters and uncertainty
We don’t get a single definite number from our analysis, we have some uncertainty too. Therefore, our results are usually written as the median value (which means we think that the true value is equally probable to be above or below this number), plus the range needed to safely enclose 90% of the probability (so there’s a 10% chance the true value is outside this range. For the mass of the bigger black hole, the median estimate is , we think there’s a 5% chance that the mass is below , and a 5% chance it’s above , so we write our result as .
Sensitivity and ranges
Gravitational-wave detectors measure the amplitude of the wave (the amount of stretch and squash). The measured amplitude is smaller for sources that are further away: if you double the luminosity distance of a source, you halve its amplitude. Therefore, if you improve your detectors’ sensitivity by a factor of two, you can see things twice as far away. This means that we observe a volume of space (2 × 2 × 2) = 8 times as big. (This isn’t exactly the case because of pesky factors from the expansion of the Universe, but is approximately right). Even a small improvement in sensitivity can have a considerable impact on the number of signals detected!


 and
and  , where
  indicates the mass of our Sun (about
  kilograms). If you’re curious what’s going with these numbers and the pluses and minuses, check out this
 is the mass of the heavier black hole and
  is the mass of the lighter black hole. The dotted lines mark the edge of our 90% probability intervals. The different coloured curves show different models: they agree which made me incredibly happy! Fig. 1 from the
  , and the small one has spin
  (these numbers have been rounded). These aren’t great measurements. For the smaller black hole, its spin is almost equally probable to take any allowed value; this isn’t quite the case, but we haven’t learnt much about its size. For the bigger black hole, we do slightly better, and it seems that the spin is on the smaller side. This is interesting, as measurements of spins for black holes in X-ray binaries tend to be on the higher side: perhaps there are different types of black holes?
 . This could mean that both black holes have small spins, or that they have larger spins that aren’t aligned with the orbit (or each other). We have learnt something about the spins, it’s just not too easy to tease that apart to give values for each of the black holes.
 . It is the new record holder for the largest observed stellar-mass black hole!
 of energy was radiated away as gravitational waves (where
  is the speed of light as in Einstein’s famous equation). This is a colossal amount of energy. You’d need to eat over eight billion times the mass of the Sun in
  , which is in the middling-to-high range. You’ll notice that we can deduce this to a much higher precisely than the spins of the two initial black holes. This is because it is largely fixed by the orbital angular momentum of the binary, and so its value is set by orbital dynamics and gravitational physics. I think its incredibly satisfying that we we can such a clean measurement of the spin.
 and spin
  for the final black hole. The dotted lines mark the edge of our 90% probability intervals. The different coloured curves show different models: they agree which still makes me incredibly happy! Fig. 3 from the
  (about six times the length of the
  (about five and a half M25s, so maybe this would be the better route for your morning commute). The total area of the event horizon is about
  . If you flattened this out, it would cover an area about the size of Montana.
  , a megaparsec is a unit of length (regardless of what Han Solo thinks) equal to about 3 million light-years. The luminosity distance isn’t quite the same as the distance you would record using a tape measure because it takes into account the effects of the expansion of the Universe. But it’s pretty close. Using our 90% probability range, the merger would have happened sometime between 700 million years and 1.6 billion years ago. This coincides with the
  of the sky. For comparison, the full Moon is about
  . This is a large area to cover with a telescope, and we don’t expect there to be anything to see for a black hole merger, but that hasn’t stopped our intrepid partners from trying. For a lovely visualisation of where we think the source could be, marvel at the
 (in units that the particle physicists like). This is tiny! It is about as many times lighter than an electron as an electron is lighter than a teaspoon of water (well,
  , which is just under a full teaspoon), or as many times lighter than the almost teaspoon of water is than three Earths.
 of the graviton from The Event (GW150914). The
 , we think there’s a 5% chance that the mass is below
  , and a 5% chance it’s above
  , so we write our result as